Quick Access
Visualizers User Guide
Array
 Array - Chart
 Swapping Lines
General
 Audio
Audio
 Logger
 Memory
 Turtle Graphics
Grid - Maze
 Maze - Graph
 Tree
Tree
Mathematics
 Maths Solver
 Graph Calculator
Resources
H.urna Explorer Guide
Array
Array - Chart
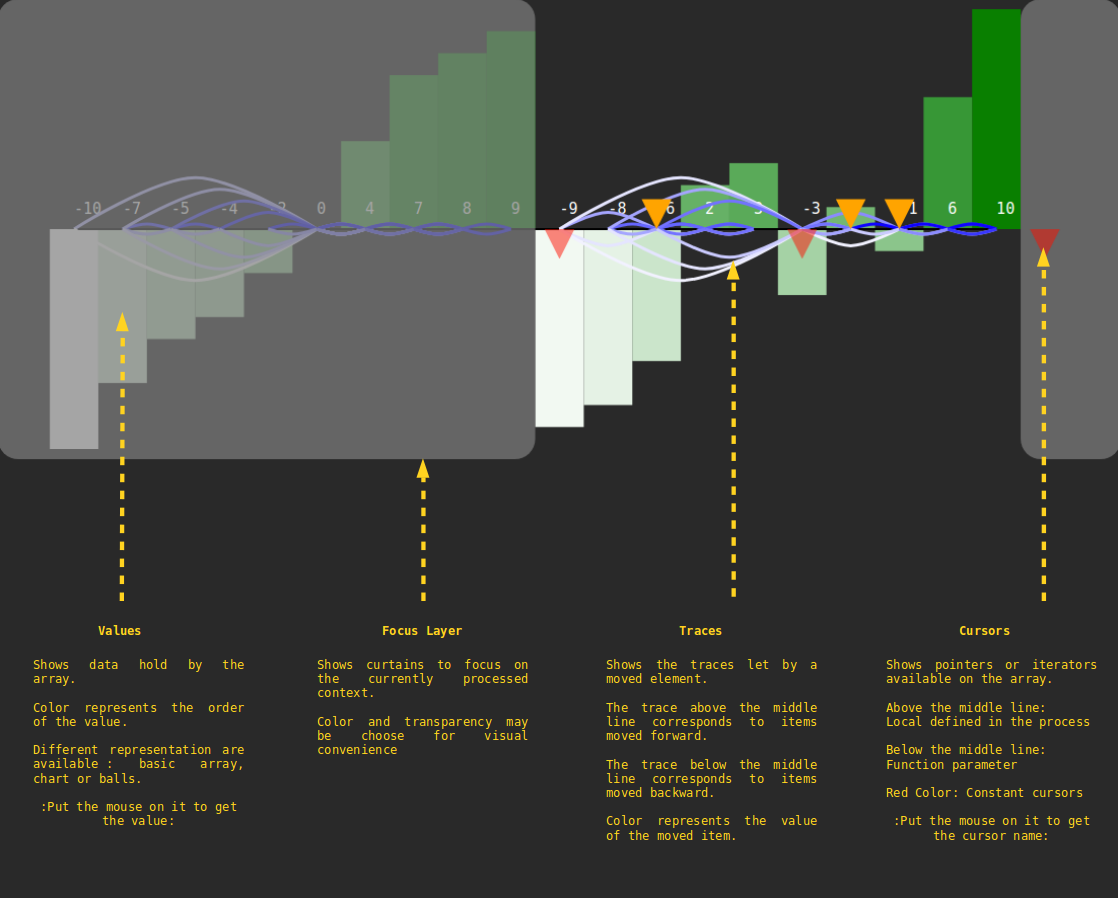
Data held by the array with different possible representations. It shows values, positions, focus layers, traces, and available cursors.
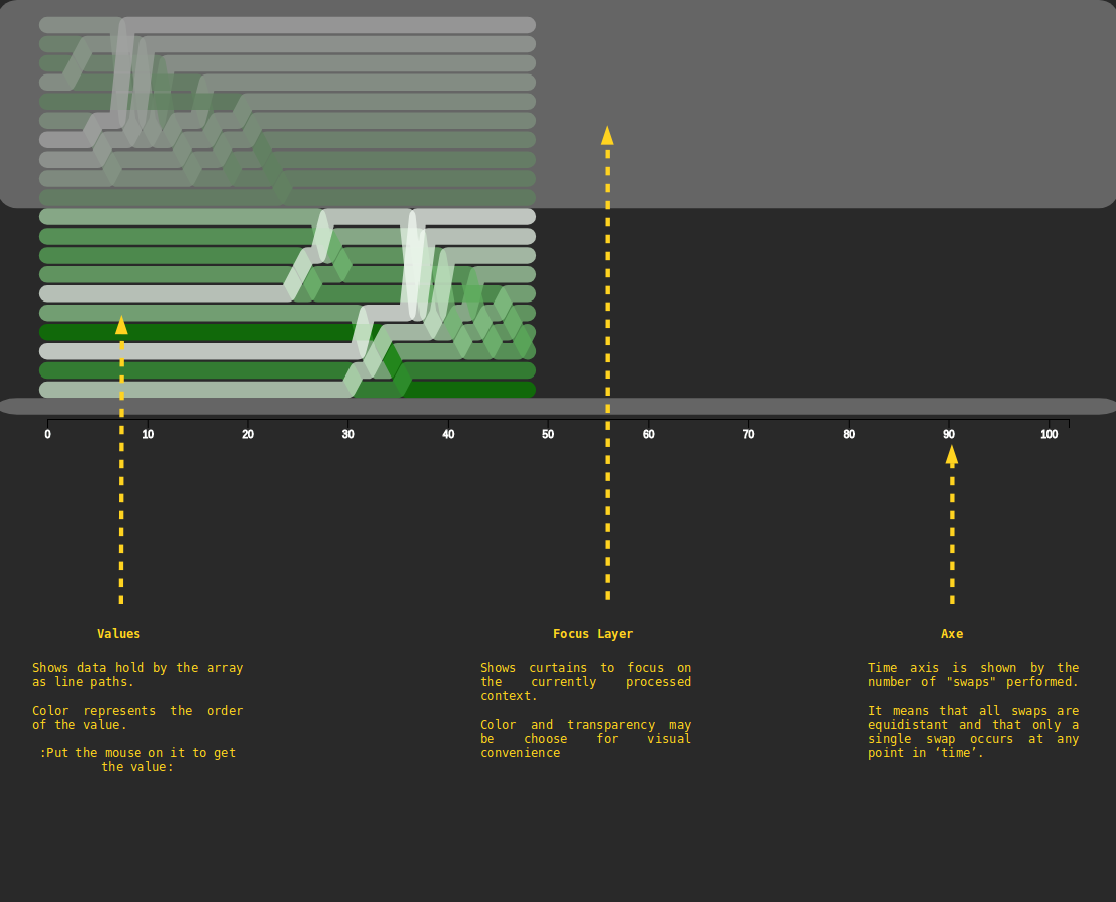
Swapping Lines
Visual representations of sorting algorithms with two-dimensional crossing lines encoding the process.
General
Audio
Experimental Sound Generator.
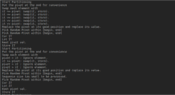
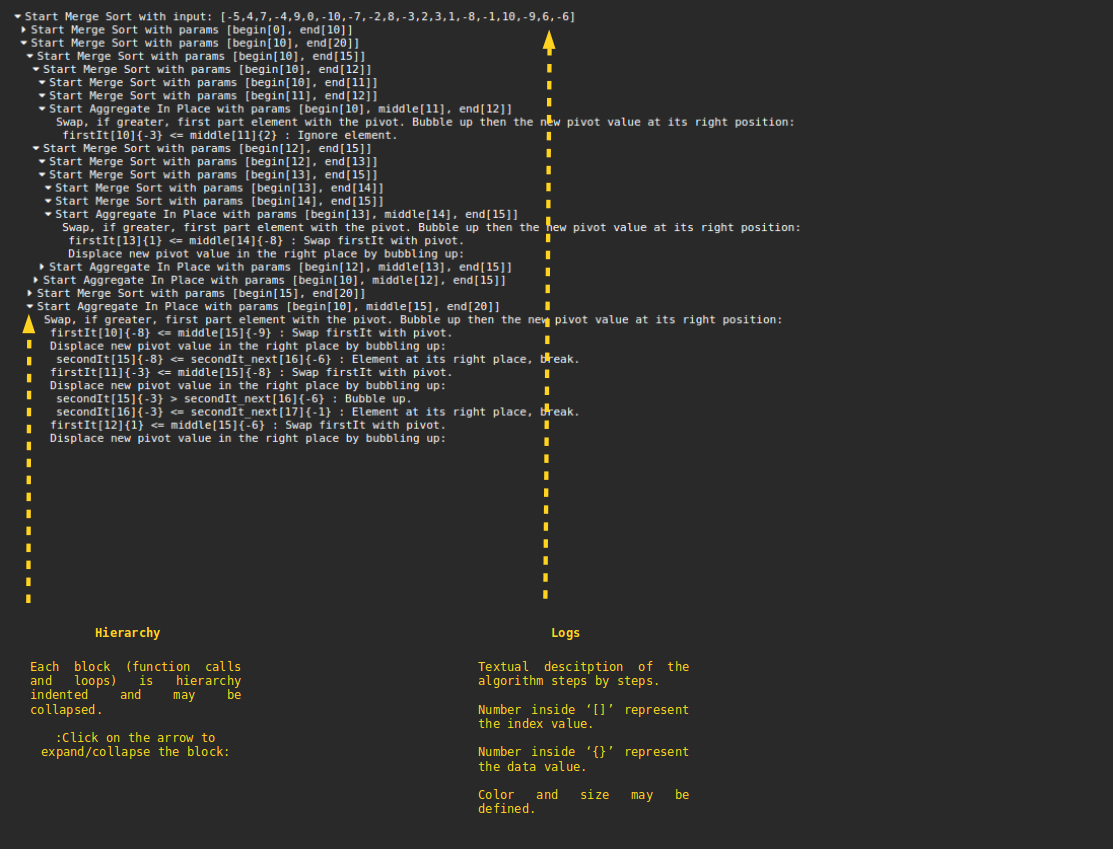
Logger
Textual description of the algorithm steps by steps as well as errors, info, warnings and remarks. Each code section is hierarchy indented and may be collapsed.
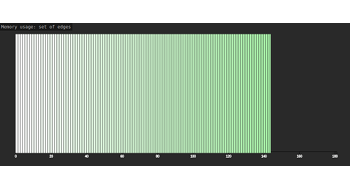
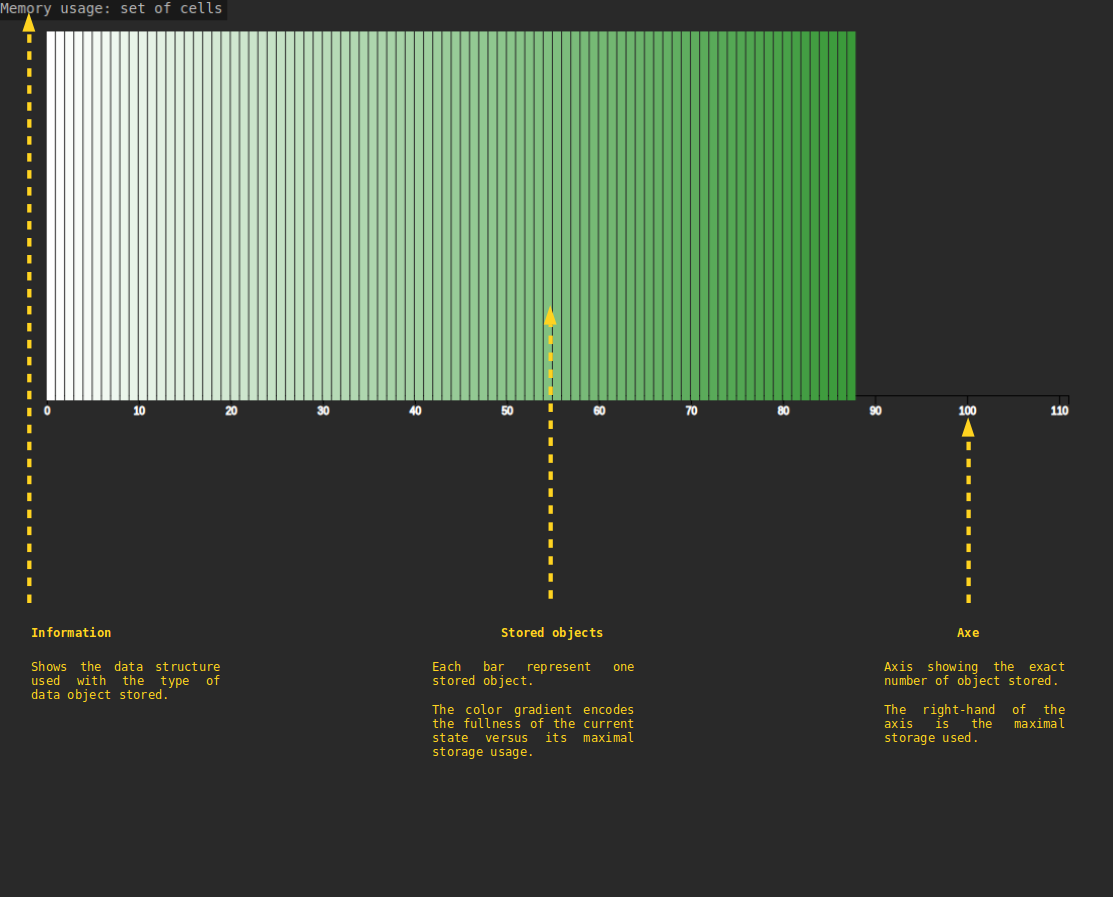
Memory
Visual representations of memory usage during the process. Each bar represents one stored object. The color gradient encodes the fullness of the data structure.
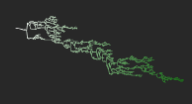
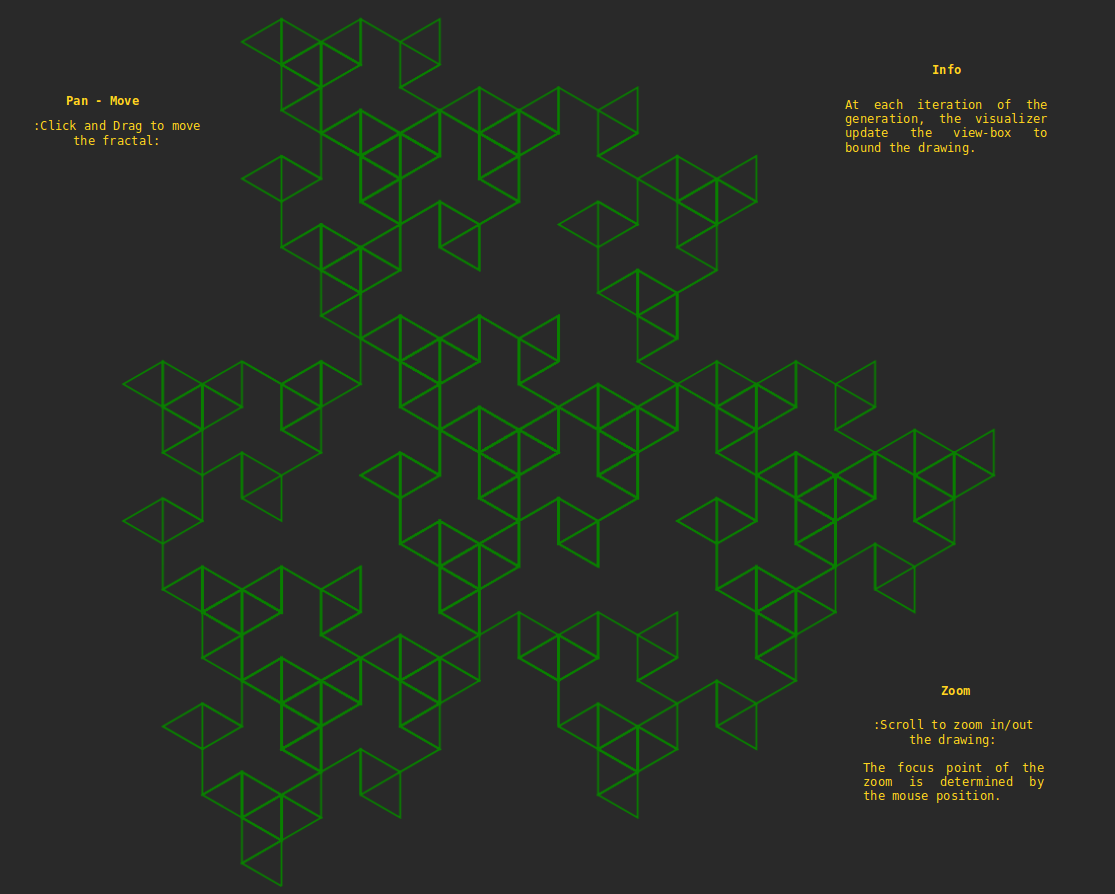
Turtle Graphics
Visual representations of an L-System fractal construction using a turtle geometry interpretation (as the old LOGO language).
Grid
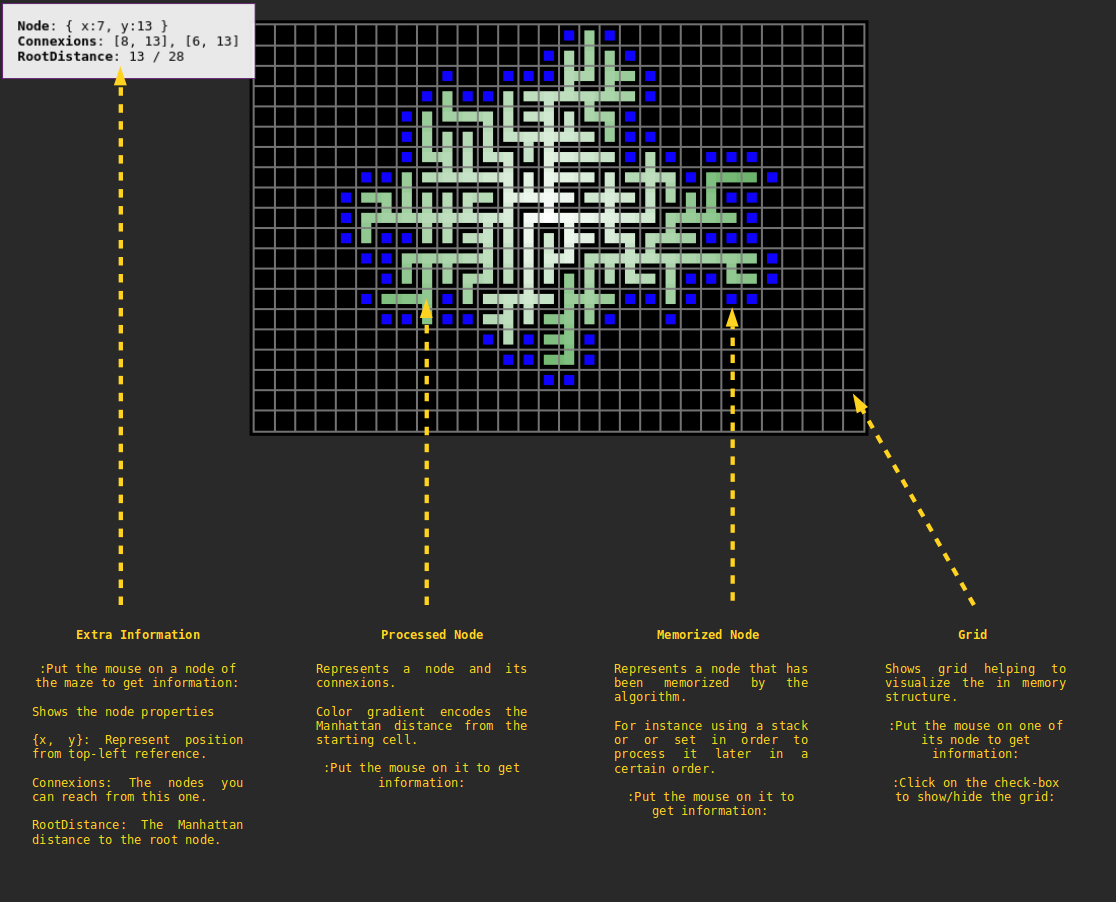
Maze Building
Visual representations of maze algorithms and color flooding. Color gradient encodes the Manhattan distance from the starting cell. Color is useful to compare the structure of mazes visually; without color, the black and white alternating cells are too noisy to offer any pre-attentive comparisons. Show walls overflooded to emphasize the structure of the maze further, reducing visual noise. Overflooding operates during flooding, depending on the start cell.
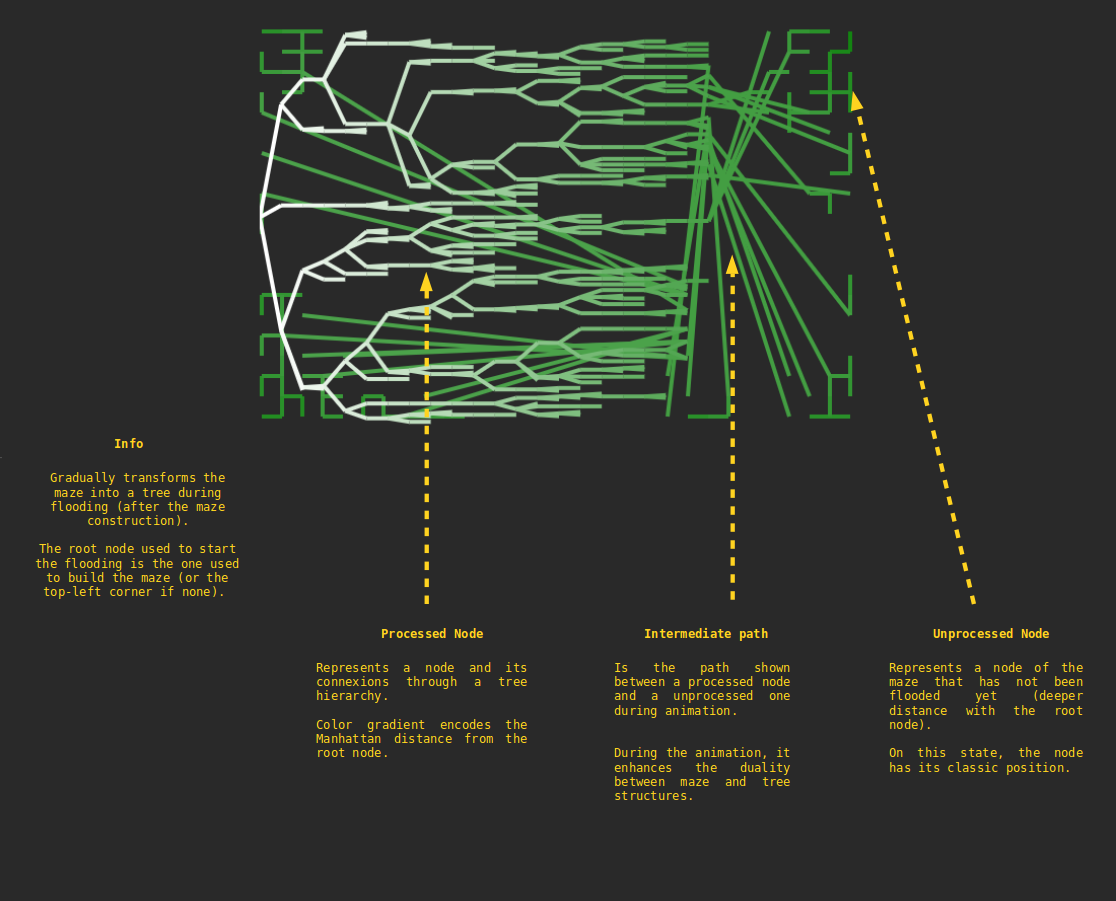
Tree Building
Specialized tree representations of maze construction algorithms to show the structure and illustrate the duality between maze and tree. From the starting cell, it gradually transforms the maze into a tree during flooding. Color gradient encodes the Manhattan distance from the starting node.
Mathematics
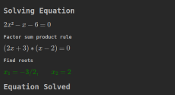
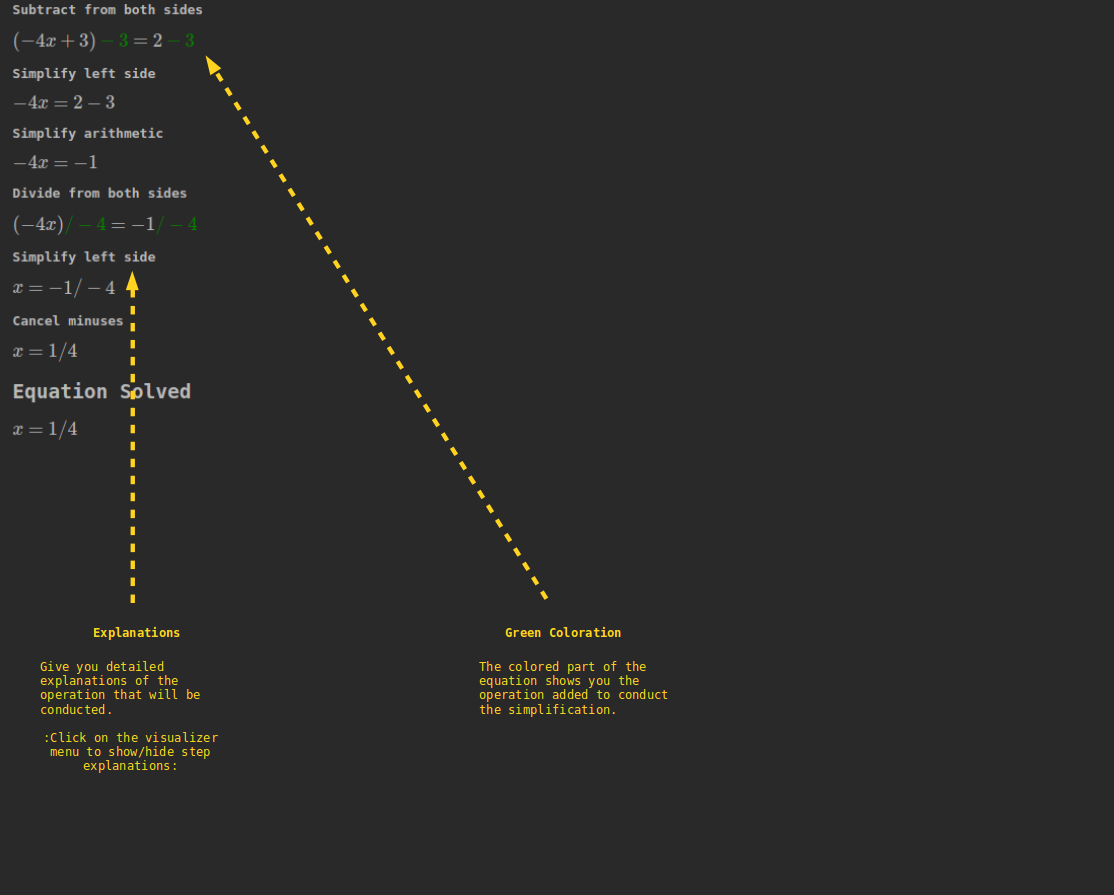
Math Logger
Textual descitption of steps by steps equation resolution. The level of detail of the resolution may be set within the editor (light by default). You may hide explanations only to retrieve the mathematical textbook.
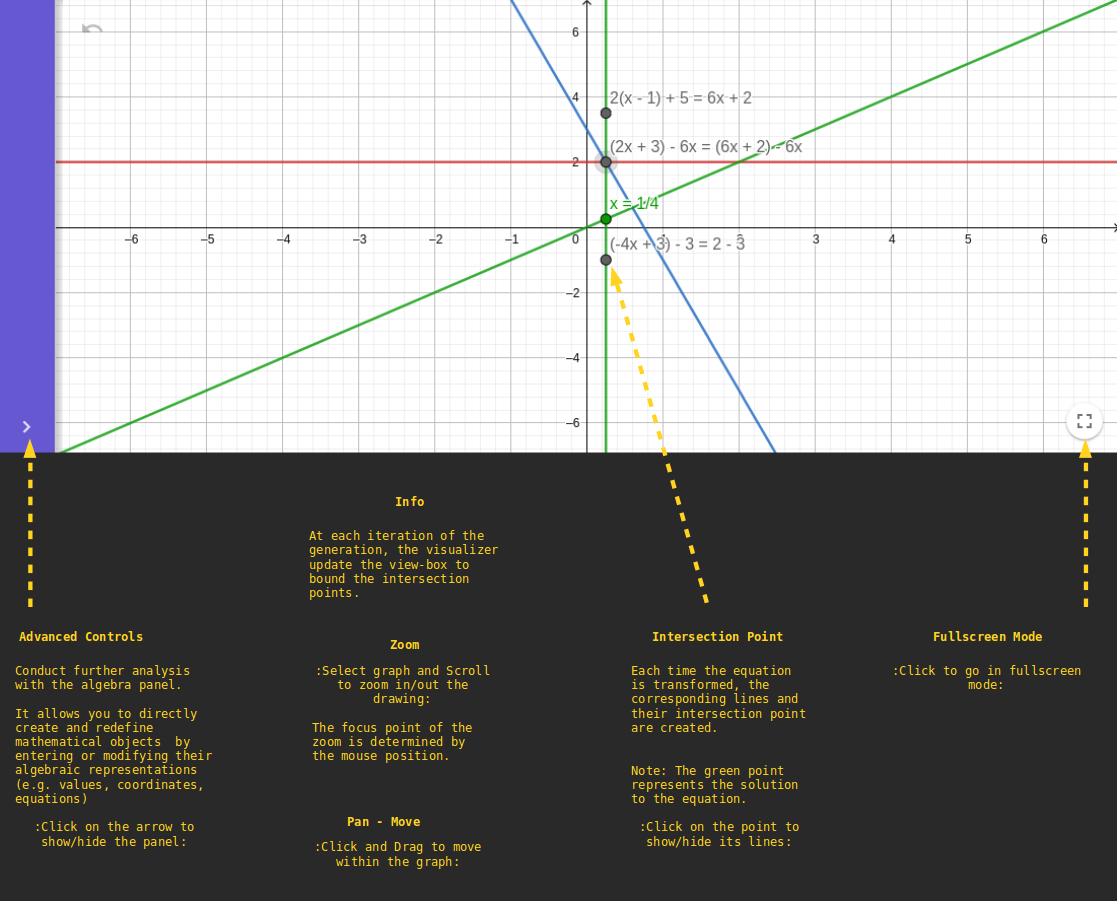
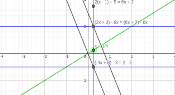
Math Grapher
An interactive graph functions drawer. It adds function step by step on solving the equation and find specific points such as lines intersections (solution of the equation). Further investigations may be conducted by playing with the graph; for instance, clicking on intersection points to show/hide the concerned equation lines. Note: More advanced controls are available within the left panel menu.