Quick Access
 Play online
Introduction
Unlike a straight line, a curve's slope constantly changes as you move along the graph. Imagine getting prepared for long hiking on a mountain: the curve is the mountain itself and we want to know what would be the slopes to handle when we could stop to make our camp (hopefully when there is no slope to be flat).
To get this slope function, mathematics has one of its most wonderful tool: differentiation. Differentiation is used to find the derivative of a function and this derivative, written f’(x), is the specific function that describes the evolution of the slope. This is used to find tons of things such as extrema of a function or describing trajectories (when and how is it accelerating / decelerating) and we are excited to write a full course about it soon.
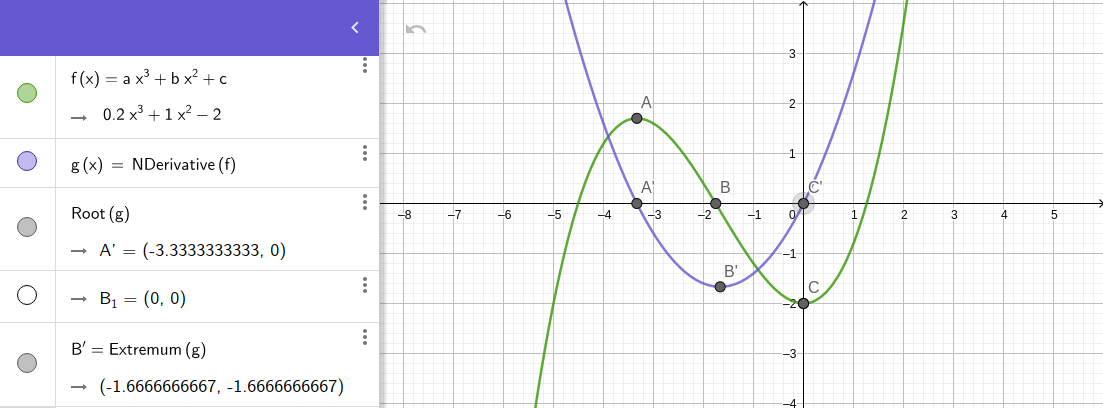
Shows a curve f(x) in green (the mountain) and its slope evolution f’(x) in blue (the derivative) : $$f(x) = 0.2x^{3} + x^{2} - 2$$ $$f’(x) = 0.6x² + 2x$$
The evolution of the slope can be read directly along with the evolution of our function which is very handy ! We may see in seconds the following interesting information: - A is an extremum, when the slope of f is equal to 0 (it is flat). A’ is then point on its derivative (as the slope, f’ = 0) - B’ is the point when f’ is at its minimum : this is where the slope goes down the most. - On C, C’ we see the second extrema : same observations as A, A’.
Using the graphing calculator will automatically compute and plot our derivative, it is an fantastic tool to visualize and check the solution of our problems.