Overview
Description
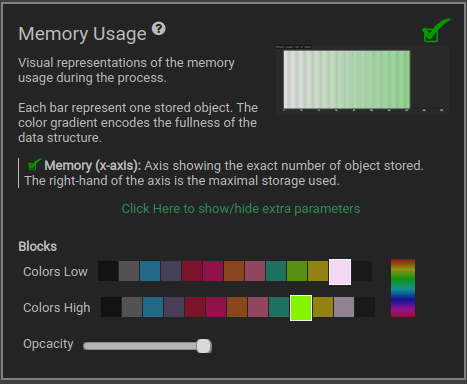
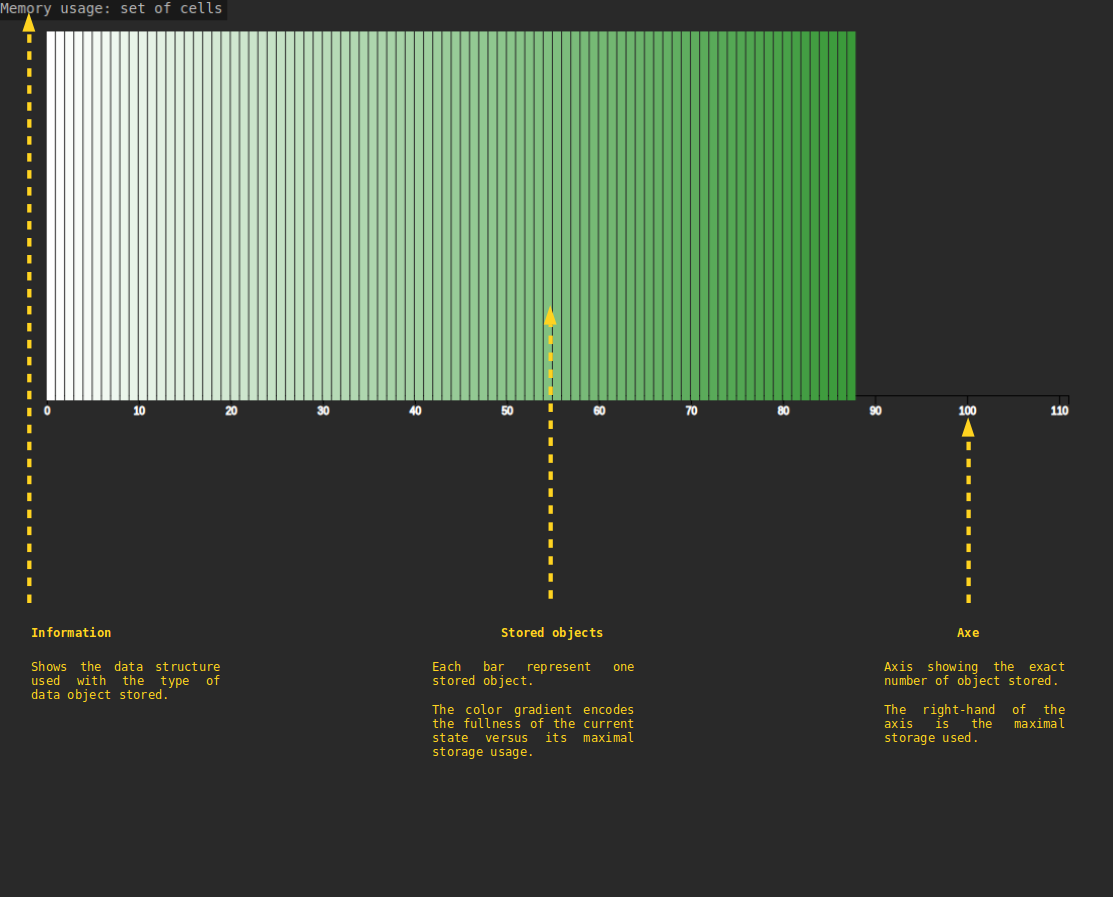
Visual representations of memory usage during the process. Each bar represents one stored object. The color gradient encodes the fullness of the data structure.
X-axis is showing the exact number of object stored. The right-hand of the axis is the maximum storage used.
Parameters